You have powered everything on. Now you need to verify the system is healthy. Here is what you look at and in what order.
First access — what you expect to see
QM9700 / Q3400 ONYX switch
Micro-USB console cable (front panel) or RJ45 console port. Connect to your laptop's USB-A port with a USB-to-serial adapter if needed.
115200 baud · 8 data bits · No parity · 1 stop bit (8N1) · No hardware flow control
Terminal apps: PuTTY (Windows), screen /dev/ttyUSB0 115200 (Linux/Mac)
Username: admin
Password: admin (change immediately)
Then: switch > enable
switch # (privileged mode)- →show version — confirms ONYX version, build date
- →show interfaces ib status — all ports should show Active after nodes boot
- →show ib sm — confirms Subnet Manager is running (or which host is running it)
- →show ib counters — baseline error counts (should be near zero on fresh bring-up)
- →show system resources — CPU, memory usage of ONYX process
1. Switch console: ONYX login
Connect a console cable to the switch (micro-USB or RJ45 to DB9 adapter, 115200 baud, 8N1). You will see the ONYX boot sequence -- Linux kernel messages, service starts, then the login prompt:
ONYX - Mellanox Networks
switch login: admin
Password: admin    <- default, change immediately

switch > enable
switch # show version
Product name:      ONYX
Product release:   3.11.2012
Build ID:          #1-dev
Build date:        2024-08-12 08:15:54

switch # show interfaces ib status
If interfaces show DOWN, the DGX nodes are not connected yet or have not finished booting.
2. DGX BMC: iDRAC web interface
Open a browser to the BMC IP address. Default credentials are on the iDRAC service tag label (or set during provisioning). The iDRAC dashboard shows power state, hardware health (all green is what you want), and gives you a virtual console to see what is displayed on the node's video output.
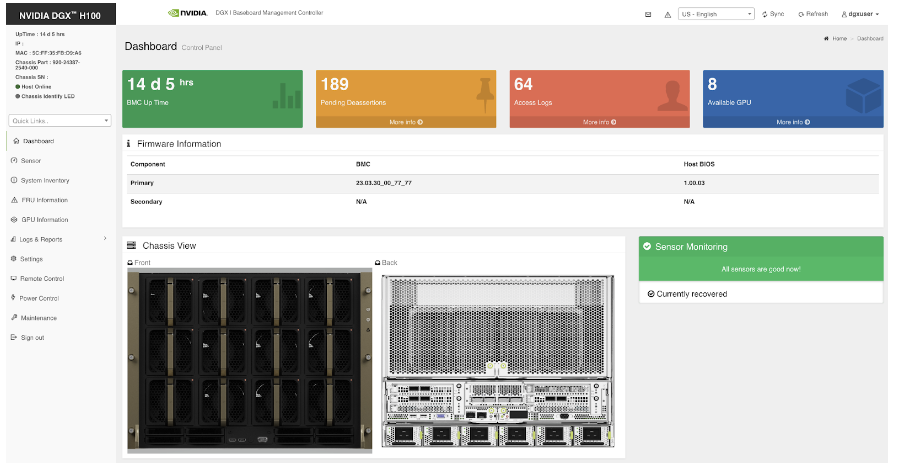
Figure: Official NVIDIA DGX H100 BMC dashboard screenshot. This is the real out-of-band management view behind the chapter's guidance to verify power state, hardware health, and remote-console availability before moving on to OS-level checks.
When DGX OS finishes booting, you can SSH directly to the node's management IP. The first thing to run:
nvidia-smi
This shows all 8 GPUs are visible, their memory, driver version, and current state. If any GPU is missing from this output, the node has a hardware problem.
ibstat
This shows all InfiniBand/RoCE ports (all 8 ConnectX-7 NICs). Each should show State: Active and Physical state: LinkUp. If any show Polling or Down, that NIC has not connected to the fabric.
3. UFM: fabric discovery dashboard
Open the UFM web interface. After initial discovery you should see:
- All switches in the topology map (green = up, red = down)
- All DGX nodes appearing as fabric endpoints
- LID assignments visible for each node
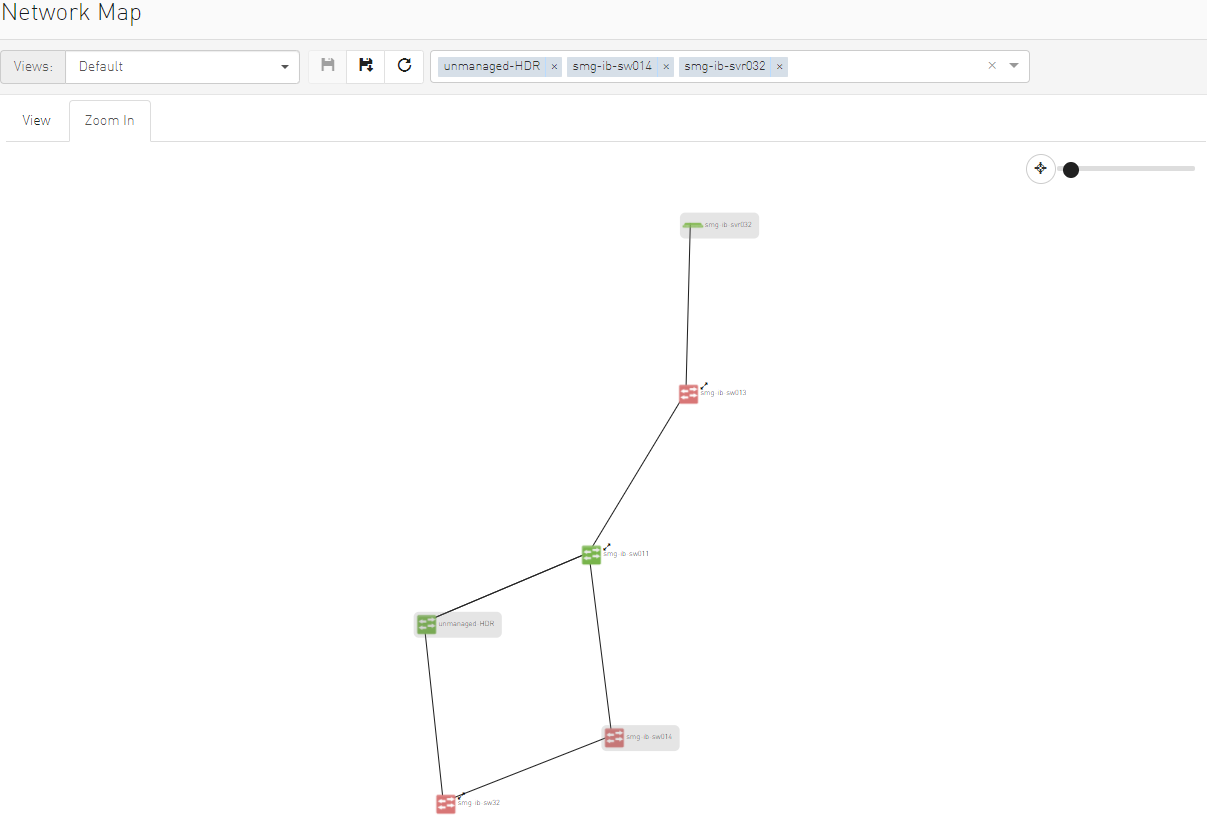
Figure: Official NVIDIA UFM topology map screenshot. Exact labels and icons vary by deployment, but this is the real operational view behind the chapter's "all switches and endpoints should appear in the fabric map" guidance.
If a node is not appearing in UFM after 15 minutes, check: is nvidia-fabricmanager running on the node? Is the ConnectX-7 physically connected to the correct leaf switch? Does UFM show the port as Active on the switch side?