Every physical link has two ends. This sounds obvious but it is the single most important thing to internalise before you run your first diagnostic command, because most Layer 1 problems only show symptoms on one end -- and if you only check one end, you will not find them.
On a RoCEv2 deployment (Spectrum-X): The ConnectX-7 NIC in the DGX node operates in Ethernet mode. The link between the NIC and the leaf switch is an Ethernet link. It has a DGX end and a switch end. Both ends need to report the link as up for traffic to flow.
On an InfiniBand deployment (QM9700): The ConnectX-7 NIC operates in InfiniBand mode. The link between the NIC and the leaf switch is an InfiniBand link. Same principle -- DGX end and switch end.
In both cases, a complete Layer 1 check means checking both ends of the cable. Not just the DGX. Not just the switch. Both.
Every link has two ends — what each side sees
ibstat: State Active. rdma link show: ACTIVE. The NIC sees optical signal and reports up.
Switch disabled port after 6 link flaps in 30 seconds. Admin Up, Oper Error-disabled. Reason: link-flap.
Why both ends matter:
The most deceptive Layer 1 fault is when the two ends disagree. The NIC reports the link as Active -- it is sending electrical or optical signals and receiving them back. The switch has disabled its port due to repeated link flaps. The NIC has no way to know the switch port is error-disabled from its own perspective -- it just sees a physical signal present and reports up. This is exactly the fault in Lab 0, and it is invisible if you only check the DGX side.
Checking the DGX end
Open the DGX host terminal (green prompt in ProDeploy -- click the DGX node in the topology).
ibstat -- the NIC's view of every link
ibstat shows you all 8 ConnectX-7 NICs simultaneously from the DGX host's perspective. Run it first -- it gives you the complete picture of all 8 rails in one output.
The output looks different depending on whether your ConnectX-7 is in RoCEv2 mode or InfiniBand mode. The key diagnostic fields are Link layer, Base lid, and SM lid.
ibstat output — explore each state
RoCEv2 / Ethernet mode -- this is what ProDeploy models:
dgx-node-a:~$ ibstat

CA 'mlx5_0'
        CA type: MT4129
        Firmware version: 28.38.1002
        Node GUID: 0x506b4b0300a1b200
        Port 1:
                State: Active
                Physical state: LinkUp
                Rate: 400
                Base lid: 0          <- zero: no IB SM, no LID assignment
                SM lid:   0          <- zero: no Subnet Manager on this fabric
                Link layer: Ethernet <- RoCEv2 mode confirmed
InfiniBand mode -- what you would see on a pure IB deployment:
dgx-node-a:~$ ibstat

CA 'mlx5_0'
        CA type: MT4129
        Firmware version: 28.38.1002
        Node GUID: 0x506b4b0300a1b200
        Port 1:
                State: Active
                Physical state: LinkUp
                Rate: 400
                Base lid: 12          <- non-zero: SM assigned LID 12 to this port
                SM lid:   1           <- non-zero: Subnet Manager is at LID 1
                Link layer: InfiniBand <- IB mode confirmed
The Base lid and SM lid fields tell you immediately which mode you are on. Non-zero = InfiniBand mode with an active Subnet Manager. Zero = Ethernet/RoCEv2 mode with no SM. You should never see Link layer: Ethernet with a non-zero Base lid -- if you do, something is misconfigured.
Reading the key fields:
State: Active -- The RDMA state machine is fully operational. This is the DGX end saying "my side of the link is up and initialised." Other values: Down (no signal -- cable unplugged or switch port disabled), Polling (signal present but handshake not completing -- switch may still be booting), Init (SM has discovered but not yet armed this port -- transient). If you have not read Ch0's RDMA internals section, QP errors will seem mysterious. The short version: a dropped packet causes a PSN gap, the QP enters error state, and the GPU on that rail cannot participate in AllReduce until the QP is reset.
Physical state: LinkUp -- Electrical or optical signal is present. You can have Physical state: LinkUp with State: Polling -- meaning the physical signal is there but the RDMA initialisation handshake has not completed. Polling with LinkUp usually means the switch port is up but the RDMA layer is not ready. Polling without LinkUp means no signal at all.
Rate: 400 -- The negotiated link speed in Gb/s. If this shows 200 or 100, the link negotiated down -- usually a cable that does not meet NDR specification.
Link layer: Ethernet -- This NIC is in RoCEv2 mode, set via mlxconfig LINK_TYPE_P1=ETH. This is what you expect on a Spectrum-X deployment.
rdma link show -- faster overview of all rails
Where ibstat gives verbose detail per NIC, rdma link show gives a compact summary of all rails at once. Use this for a quick check:
dgx-node-a:~$ rdma link show

link mlx5_0/1 state ACTIVE physical_state LINK_UP
  type RoCE  netdev eth0  roce_mode: RoCEv2

link mlx5_1/1 state ACTIVE physical_state LINK_UP
  type RoCE  netdev eth1  roce_mode: RoCEv2

link mlx5_3/1 state ACTIVE physical_state LINK_UP
  type RoCE  netdev eth3  roce_mode: RoCEv2
  WARNING: PFC disabled -- lossless operation not guaranteed

[... mlx5_4 through mlx5_7 all ACTIVE ...]
Notice: netdev eth0, netdev eth3. Each ConnectX-7 NIC has two names -- mlx5_N at the RDMA layer and ethN at the Ethernet layer. Same physical card, two software identities. mlx5_0 and eth0 are the same hardware.
The WARNING on mlx5_3 -- PFC disabled -- tells you the RDMA link is up physically, but PFC is not configured. The physical layer is fine; the lossless configuration layer is not. You will investigate this in Act 3.
What the DGX end tells you -- and what it does not:
If all 8 NICs show State: Active and Physical state: LinkUp, the DGX is satisfied. But this only confirms the DGX end of each cable sees a signal and completed RDMA initialisation. It says nothing about whether the switch port is healthy, whether the switch has error-disabled the port, or whether the switch is seeing errors on its end of the cable.
That is why you must also check the switch end.
Checking the switch end
Open the leaf switch terminal (blue prompt in ProDeploy -- click the leaf switch in the topology).
On a Spectrum-X deployment you use show interface counters. On an ONYX InfiniBand switch you use show interfaces ib status. Both show you the switch's perspective on the same physical cables that ibstat showed you from the DGX side.
For RoCEv2 / Spectrum-X -- show interface counters:
leaf-switch # show interface counters

Interface swp1        <- the switch port connected to DGX mlx5_0
  Admin state:   Up
  Oper state:    Up
  Link speed:    400G

Interface swp4        <- the switch port connected to DGX mlx5_3
  Admin state:   Up
  Oper state:    Up
  Link speed:    400G
Note the naming convention: Cumulus Linux and NVUE on Spectrum-X switches use swp (switchport) names -- swp1, swp2, ... swp32 for front-panel ports. The DGX NIC side uses eth0/mlx5_0, eth3/mlx5_3 etc. These are different names for each end of the same cable. When reading diagnostics, swp1 on the switch and eth0 (or mlx5_0) on the DGX refer to the two ends of the same physical link.
For InfiniBand / ONYX -- show interfaces ib status:
leaf-switch # show interfaces ib status

IB Interface  Admin  Oper     Width  Speed
IB1/1         Up     Active   4x     NDR     <- DGX node A, Rail 0
IB1/2         Up     Active   4x     NDR
IB1/3         Up     Active   4x     NDR
IB1/4         Up     Polling  --     --      <- something wrong on Rail 3
IB1/5         Up     Active   4x     NDR
Port IB1/4 shows Oper: Polling. The DGX end showed State: Active for mlx5_3. The DGX thinks the link is fine. The switch disagrees. This is the two-end asymmetry in action.
The asymmetry: when the two ends disagree
DGX end (ibstat):              State: Active      <- NIC says link is up
Switch end (show interfaces):  Oper: Polling      <- switch says link is not ready
Or in the Lab 0 fault scenario:
DGX end (rdma link show):     state ACTIVE        <- NIC says fine
Switch end (show topology):   ERROR-DISABLED      <- switch disabled the port
The NIC has no knowledge that the switch disabled its port. Signals are still flowing on the cable -- the NIC sees them and reports Active. Only by checking show topology (which queries the switch side) do you discover the switch is error-disabled on Rail 3. This is precisely why the two-end check is mandatory. The DGX-only view is incomplete.
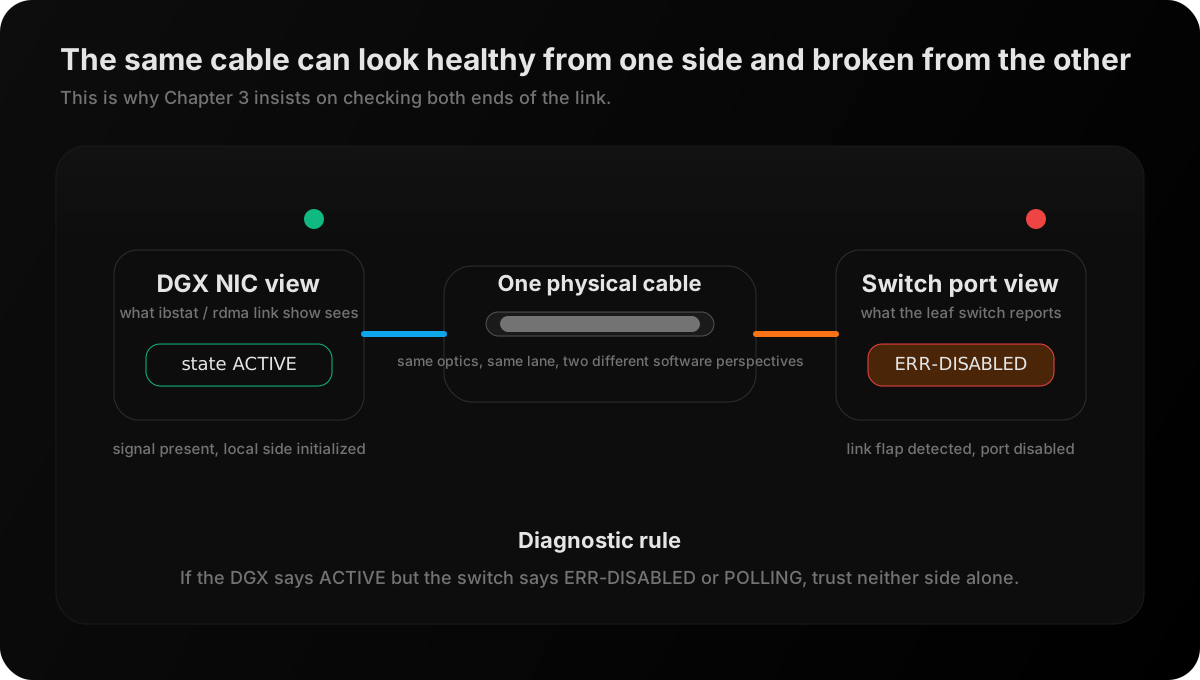
Figure: A single cable can produce two valid but different stories. The DGX NIC may still report an active local link while the switch has already disabled its port due to flaps or policy.