You have been reading about real commands on real devices. The ProDeploy simulator is your practice environment. Before you enter the labs, you need to understand exactly how it is structured -- because the structure mirrors how you would work in a real cluster.
ProDeploy simulator — one terminal per device
In a real cluster investigation you have multiple SSH sessions open simultaneously — one per device. ProDeploy mirrors this exactly. The topology diagram is your map. Click a device to open a terminal session for that device. The prompt, colour scheme, and available commands all change to match the device you clicked.
Device context enforcement
Typing show dcb pfc in a DGX terminal returns: "Command not available on this device. Try: Leaf switch." This is intentional — it reinforces which device owns which commands, exactly as real hardware does.
The core design principle: one terminal per device
In a real AI cluster investigation, you have multiple SSH sessions open simultaneously. One window is your DGX host. Another is the leaf switch. A third might be the UFM server. You never mix commands across sessions -- you know exactly which device you are on because the prompt tells you, and your muscle memory knows which commands belong in which session.
ProDeploy mirrors this exactly. The lab topology diagram is your map. Click a device on the map and a terminal session opens for that device. The prompt changes, the colour scheme changes, and the command set changes. You cannot type show dcb pfc in a DGX terminal and expect it to work -- just as you cannot on real hardware. The simulator enforces device context.
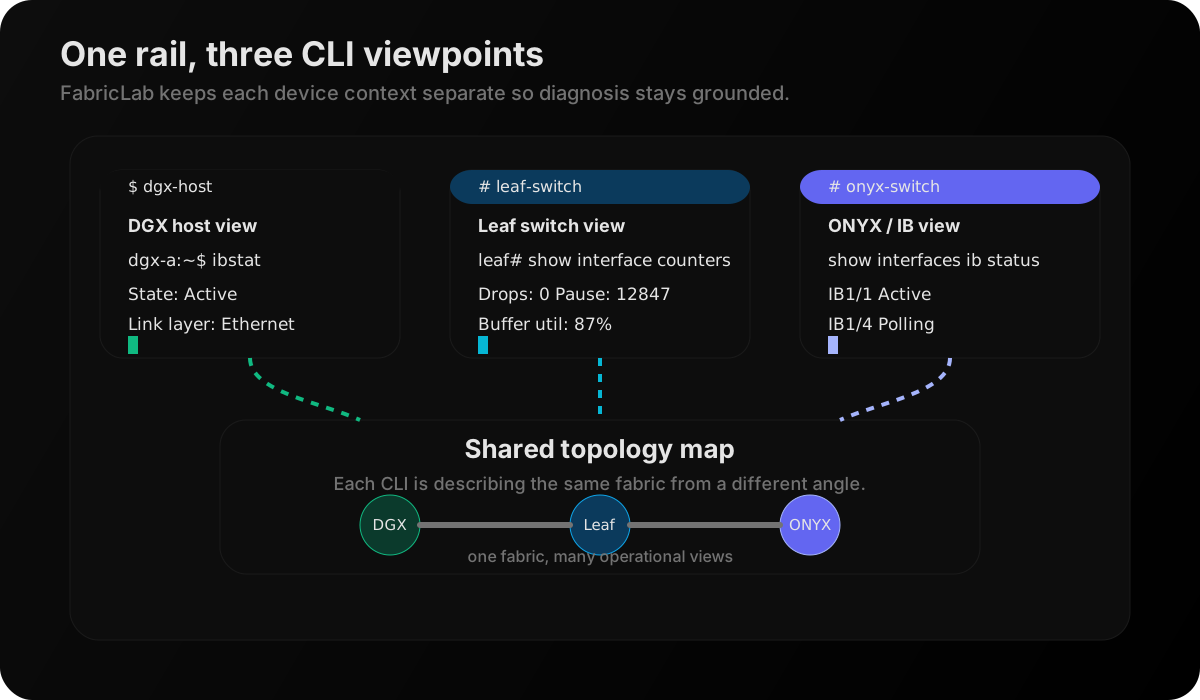
Figure: Real investigations rarely live in one shell. The same rail is read from several device-specific CLIs, which is why ProDeploy makes terminal context explicit instead of blending all commands into one prompt.
This means you will work with multiple terminal tabs open simultaneously during a lab:
- Green prompt -- DGX host (DGX OS) --
ibstat,rdma link show,ethtool - Blue prompt -- Leaf switch (Cumulus/Spectrum) --
show dcb pfc,show interface counters - Purple prompt -- Spine switch (ONYX) --
show interfaces ib status,show ib counters
What each device context models accurately:
The DGX host context faithfully represents the RDMA diagnostic commands you would run after SSHing to a real DGX node running DGX OS. The leaf switch context faithfully represents the Cumulus Linux / Spectrum-X CLI. When you type show dcb pfc on the switch tab and see PFC enabled, that output format, those fields, and the state changes you trigger with disable pfc all match what real Spectrum hardware produces.
Specifically, each context models:
DGX host: RDMA link state per rail, NIC topology map, per-NIC statistics
Leaf switch: PFC state (enabled/disabled, priority, pause quanta, watchdog), ECN/DCQCN state, interface counters (drops, pauses, buffer utilisation), RoCEv2 configuration summary, switch port error states
What the simulator does not model:
The simulator is a teaching tool, not a full emulator. It does not model packet-level RDMA behaviour, real-time congestion dynamics, the UFM management plane, the full NCCL communication pattern, or hardware failure modes beyond the specific scenarios in each lab. What it does model, it models correctly -- the commands are real, the output format is real, the diagnostic logic is real.
How to get the most from the labs:
Treat the topology like your real cluster map. Click the device you want to investigate, work in that terminal session, then click another device when you need a different perspective. The diagnostic workflow from this chapter -- physical first, counters second, configuration third -- maps directly onto which device tab you open and in what order.
When you finish a lab, ask: what would real hardware give me that the simulator does not show? That reflection is where the learning compounds.