The CLI and ibdiagnet give you raw data. UFM gives you context -- it shows you where a problem is in the physical topology, what events led up to it, and what other symptoms appeared at the same time.
UFM event log -- reading fabric history
# UFM CLI (or web GUI Events tab)
ufm_cluster -u admin -p password events list --severity ERROR --hours 24
UFM event log — click each event to read the story
DGX-node-12 experienced a NCCL AllReduce timeout during the 6-second window when routing tables were being reprogrammed. The NCCL job on this node aborted. The root cause chain: failing transceiver → link flapping → SM reroute → routing disruption → NCCL timeout.
Timestamp           Severity  Event                          Component
------------------  --------  ----------------------------   --------------------
2024-03-15 02:14:33  ERROR    Port down                     QM9700-2/port7
2024-03-15 02:14:35  WARNING  Link recovery                 QM9700-2/port7
2024-03-15 02:14:37  ERROR    Port down                     QM9700-2/port7
2024-03-15 02:14:38  WARNING  Link recovery                 QM9700-2/port7
2024-03-15 02:14:41  ERROR    Port down                     QM9700-2/port7
2024-03-15 02:14:43  WARNING  Link recovery                 QM9700-2/port7
2024-03-15 02:21:18  ERROR    SM rerouted around fault      QM9700-2/port7
2024-03-15 02:21:22  INFO     Routing tables reprogrammed   All switches
2024-03-15 02:21:24  WARNING  Training job NCCL timeout     dgx-node-07
Reading this event sequence:
Events at 02:14:33-02:14:43 show a port flapping -- going down and recovering six times in ten seconds. This is a link instability event, almost certainly a bad cable or transceiver.
At 02:21:18, after the port flapping stabilised (or the port finally stayed down), UFM detected the topology change and started rerouting. At 02:21:22, new routing tables were programmed across all switches. At 02:21:24, the NCCL timeout on dgx-node-07 is the training job failure that resulted from the brief routing disruption during the SM's reroute sweep.
The timeline tells the story: Physical fault -> link flapping -> SM detects topology change -> SM reroutes (brief disruption) -> training job times out. Without the UFM event log, you would only see the training job timeout and have no idea why it happened.
UFM topology view for physical location
UFM's topology view maps fabric events to physical rack and slot positions. When ibdiagnet says "QM9700-2 port 7", UFM can show you:
- Which rack holds QM9700-2
- Which cable runs from port 7
- Which DGX node that cable connects to
- Which GPU rail is affected
- The physical path through the data center to get to that switch
This physical location context is what makes UFM indispensable for large clusters. Without it, finding the right cable in a SuperPOD with thousands of cables is extremely time-consuming.
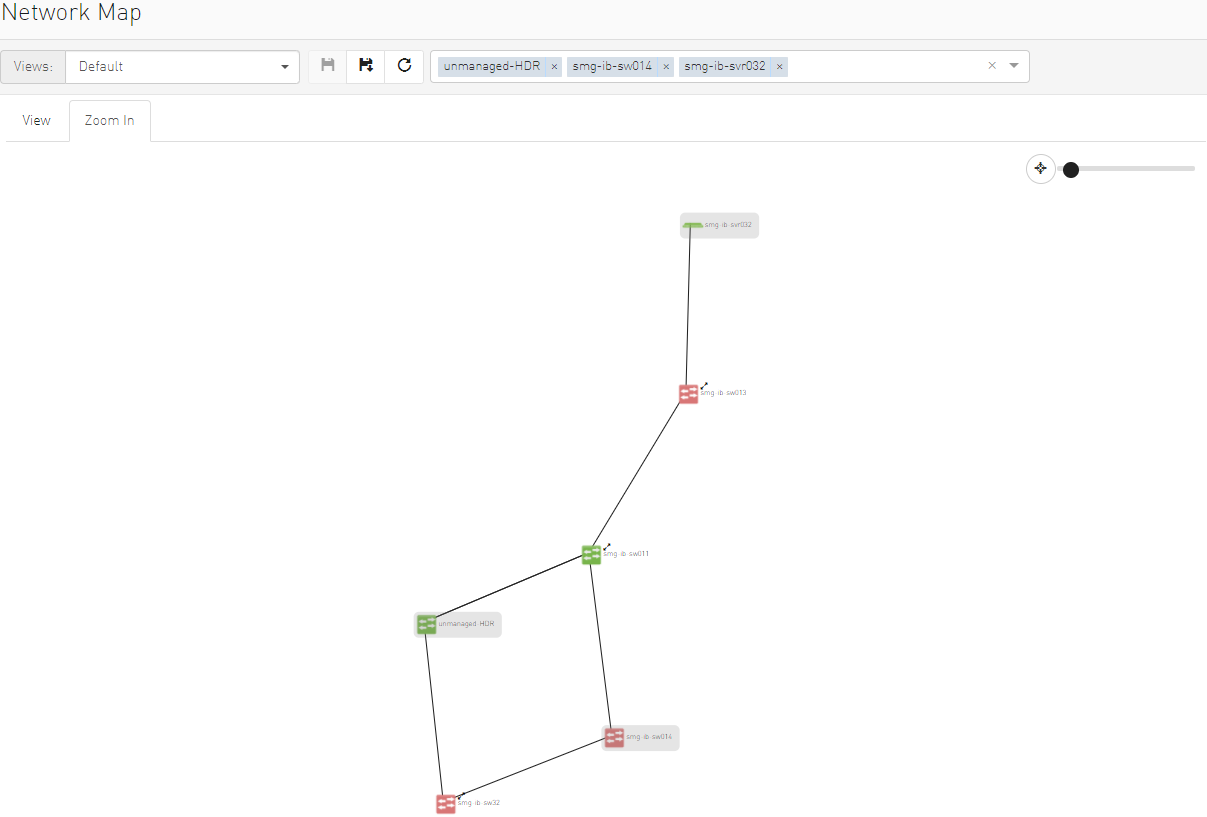
Figure: Official NVIDIA UFM network map view. This is the operational screen that turns a switch and port identifier into physical location and nearby fabric context.
UFM REST API -- programmatic monitoring
For integration with external monitoring systems (Grafana, PagerDuty, custom dashboards), UFM exposes a REST API:
import requests

UFM_BASE = "https://ufm-server:443/ufmRest/v2"
AUTH = ("admin", "password")

# Get all ports with errors
response = requests.get(
    f"{UFM_BASE}/monitoring/portcounters",
    auth=AUTH,
    verify=False,  # Accept self-signed cert
    params={"filter": "symbol_error_counter>100"}
)

ports_with_errors = response.json()
for port in ports_with_errors:
    print(f"Port {port['guid']} on {port['switch']}: {port['symbol_error_counter']} symbol errors")
The REST API gives you:
- Real-time port counters (symbol errors, link errors, bandwidth utilisation)
- Topology queries (what is connected to what)
- SM status and routing table contents
- Event history
- Fabric health scores
Most production clusters run automated UFM API polling every 60 seconds, feeding into Prometheus, which triggers PagerDuty alerts when error counters exceed thresholds.